
WTI Oil Price Testing Uptrend Line and Bearish Wedge Pattern
chart by ICM.com
Chartist Trader
6/19/20241 min read
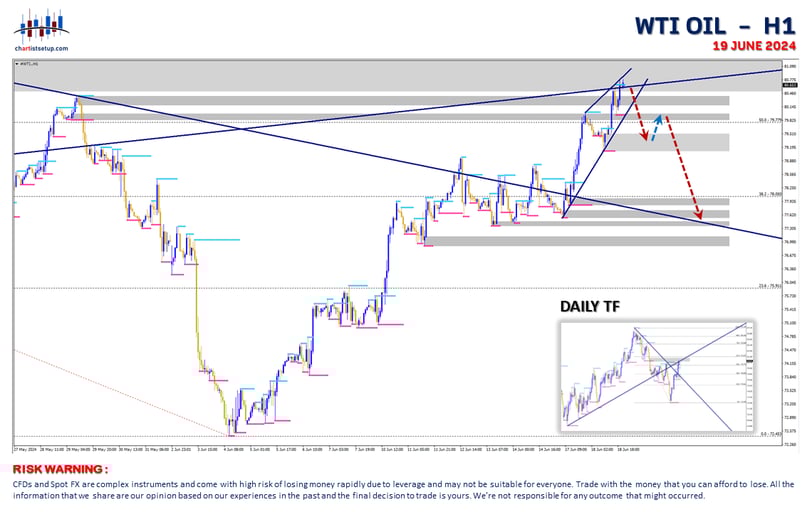
On the daily timeframe, it is clear that the price is testing a broken uptrend line, indicating a possible correction. This test is occurring within the supply area. Meanwhile, on the H1 timeframe, a Bearish Wedge chart pattern is visible. If the price breaks this pattern, it will provide further confirmation of a correction.
Follow Us :
CFDs and Spot FX are complex instruments and come with high risk of losing money rapidly due to leverage and may not be suitable for all kind of traders or investors.
Most of traders or investors accounts lose money when trading CFDs and Forex. You should consider whether you understand how CFDs and Forex work and can afford the high risk of losing your money.
All information that we share in this CHARTIST SETUP website are based on our professional experiences in the past and the final decision to trade is yours. Please remember that past performance may not be indicative of future results.
Trade or invest with the money that you can afford to lose. We’re not responsible for any possible outcome that might occurred.
Copyrights @2025 CHARTIST SETUP.
All rights reserved.