
GOLD Price Faces Testing Period Amid USD Weakness, Potential Symmetrical Triangle Formation
chart by ICM.com
Chartist Trader
6/25/20241 min read
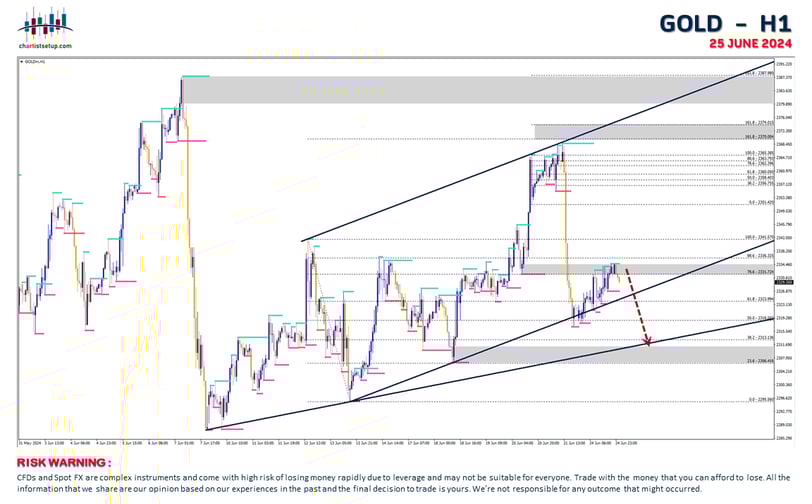
Despite the negative sentiment surrounding USD, the price of gold may undergo a minor bearish movement towards the opposite uptrend line, presenting a testing ground for both buyers and sellers. Gold prices could potentially form a symmetrical triangle pattern, suggesting sideways movement, a pattern also visible on the daily timeframe.
Follow Us :
CFDs and Spot FX are complex instruments and come with high risk of losing money rapidly due to leverage and may not be suitable for all kind of traders or investors.
Most of traders or investors accounts lose money when trading CFDs and Forex. You should consider whether you understand how CFDs and Forex work and can afford the high risk of losing your money.
All information that we share in this CHARTIST SETUP website are based on our professional experiences in the past and the final decision to trade is yours. Please remember that past performance may not be indicative of future results.
Trade or invest with the money that you can afford to lose. We’re not responsible for any possible outcome that might occurred.
Copyrights @2025 CHARTIST SETUP.
All rights reserved.