
Double Top Formation and Potential Selling Pressure in WTI Oil Prices
chart by ICM.com
Chartist Trader
6/25/20241 min read
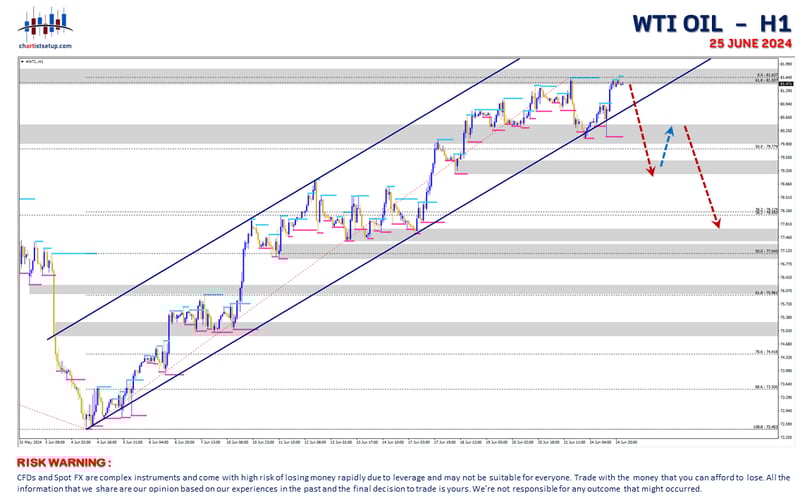
From a technical standpoint, a double top pattern has formed, which typically signals a potential reversal in WTI oil prices. Although the price closed below the uptrend line, it coincided with a support area. If the closing price breaks below the low point of the uptrend line, it could trigger additional selling pressure as traders take profits.
Follow Us :
CFDs and Spot FX are complex instruments and come with high risk of losing money rapidly due to leverage and may not be suitable for all kind of traders or investors.
Most of traders or investors accounts lose money when trading CFDs and Forex. You should consider whether you understand how CFDs and Forex work and can afford the high risk of losing your money.
All information that we share in this CHARTIST SETUP website are based on our professional experiences in the past and the final decision to trade is yours. Please remember that past performance may not be indicative of future results.
Trade or invest with the money that you can afford to lose. We’re not responsible for any possible outcome that might occurred.
Copyrights @2025 CHARTIST SETUP.
All rights reserved.